Small Business Labs

article thumbnail

The Long Term Shift to Contract Labor by Small Businesses

Small Business Labs

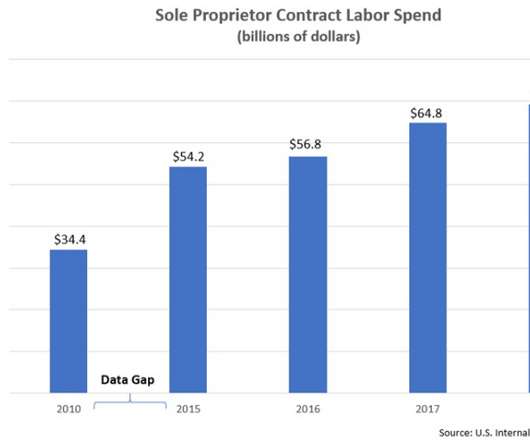
In 2003 contract labor about 20% of total labor costs of sole proprietors. Spending on salaries and wages grew from $73.7 billion in 2010 to $97.9 billion in 2018, or an annual growth rate of 3.61%. In other words, spending on contract labor increased at 2.5x the spending on traditional employee salaries and wages from 2010 to 2018.

2018 214
article thumbnail

Led by Retail, The Surge in New Business Applications Continues

Small Business Labs

Back in 2003-2007 80% of new retail trade business applications came from firms planning on hiring traditional employees.  In addition to the surge, both charts also illustrates the longer-term shift away from shift employer business applications (high propensity applications, in yellow) and towards applications from solopreneurs.

2003 175
Insiders

Sign Up for our Newsletter

This site is protected by reCAPTCHA and the Google Privacy Policy and Terms of Service apply.

article thumbnail

Use of Contract Labor by Small Businesses Continues to Grow

Small Business Labs

  Way back in 2003, contract labor was only about 20% of the labor costs of sole proprietors.   Over the same period, spending on salaries and wages (meaning traditional employees) rose from $73.7 billion to $90.9 billion, an increase of 23%.  By 2010 it has risen to 31%. And in 2016 it reached 39%. 

2003 183
article thumbnail

The Number of Nonemployer Businesses Continued to Grow in 2016

Small Business Labs

 Since 2003, for example, the number of nonemployer businesses has increased by about 5.7 Receipts increased 1.5 percent from $1.15 trillion in 2015 to $1.17 trillion in 2016. This continues a pattern of about 2% growth per year in the number of nonemployer businesses over the past couple of decades. Since

2016 193
article thumbnail

The On-Demand Economy Driving Growth of Nonemployer Businesses

Small Business Labs

 Since 2003 the number of nonemployer businesses has increased by about  5.2 Census  released their 2015 data on non-employer businesses last week.    Overall, the number of U.S. nonemployer businesses continued it's steady growth, increasing by 2.1% million from 2014 to 2015. Since

2015 128
article thumbnail

Use of Contract Labor by Sole Proprietors Surging

Small Business Labs

In 2013 contract labor was 36% of total labor costs, up from 31% in 2010 and just 20% in 2003.  .  As the chart below shows, sole proprietor contract labor expenses increased 38% between 2010 and 2013.    Over the same period salary and wage expense increased only 10.7%.

2003 100
article thumbnail

The Number of Nonemployer Businesses Grew to 23 Million in 2013

Small Business Labs

  Over the decade from 2003 to 2013 the number of nonemployer businesses increased by 4.4 Census released the 2013 nonemployer business data. In 2013 there were 23.0 million businesses without paid employees in the U.S. This  This is an increase of 270,000, or 1.2%

2013 100